Our reserve studies have numerous sections that address different aspects of the budgeting process. You will find a summary of the findings, component list, project expenditure reports as well as a table of contents and index for easy navigation of the reserve study. Below are screenshots of a typical study with comments on each section. Click on the picture to enlarge.
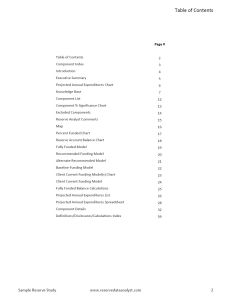
Table of Contents
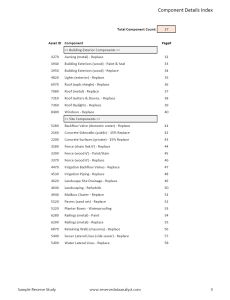
The Table of Contents lists each section of the reserve analysis study with the corresponding page number the section begins on. Utilize it to easily navigate throughout the reserve study. This along with the Component Index are excellent navigational tools we provide to our Clients in each reserve study.
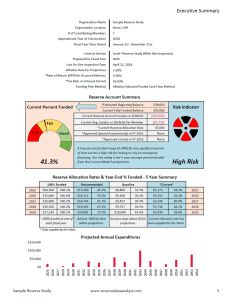
Summary Page
The findings of the reserve study are summarized for the reader. This includes a percent funded calculation and an ideal reserve account balance (Fully Funded Balance) and a risk assessment indicator. A 5-year summary of the funding models can be also be found here.
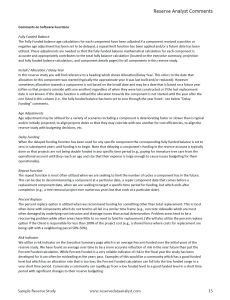
Reserve Analyst Comments
This page will outline any specific concerns or areas of clarification the reserve analyst has as well as list any special assessments, loans or other revenue sources to fund the reserve account that have been implemented or are planned per the Clients information to us.
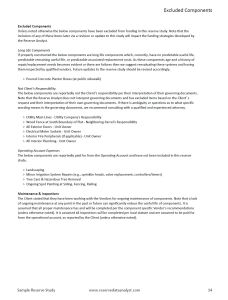
Excluded Components
This page lists the components which have been excluded from the component list due to a variety of reasons such as being a long life component or due to it being the Unit Owner's responsibility. Additionally component which are considered a gray area by communities are discussed here (e.g., per interpretation of their governing documents.
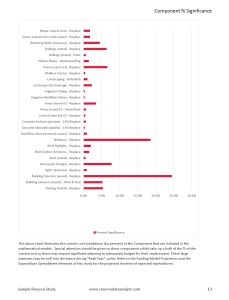
Component % Significance
This chart illustrates the current percent of total cost breakdown of the Components in the community. Special attention should be given to those components which take up a bulk of the % of the current cost as these may require significant planning to adequately budget for their replacement.
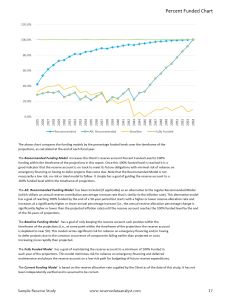
Percent Funded Chart
This chart compares funding models by the percentage funded annually over the 30-year timeframe of the reserve study. Note that the Recommended Funding Plan increases the Association's percent funded level to 100% funding within the timeframe of this study. Often the Current Model has its own chart due to significant deficiency which would make the chart unreadable.
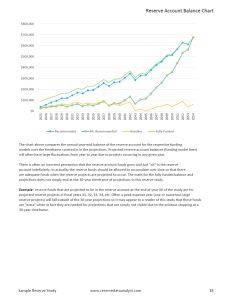
Reserve Account Balance Chart
This chart compares the annual year-end balance of the funding models over the 30 years covered in the reserve study. Note that while the reserve account balance could not realistically be in a negative territory it is reported this way as a visual representation of the amount that the reserve account is projected to be in shortfall (Current Model - if applicable).
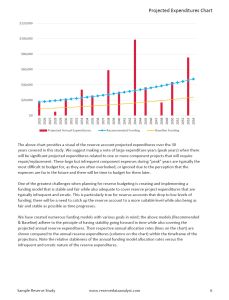
Annual Expenditures Chart
This annual expenditure chart shows the projected expenses over the 30-year timeframe of the reserve study. Special notes should be made of years when there are very large expenses (peak years) as these have proved to be most difficult to budget for; these large expense years are generally infrequent but make up the bulk of the expenses for most of our Clients.
Funding Model - Summary
A Funding Model Summary for each reserve funding model is in the study. Typically at a minimum Recommended, Baseline and Current Funding Models will be included. Includes comments about the adequacy for the funding plan plus positive and negative factors for each.
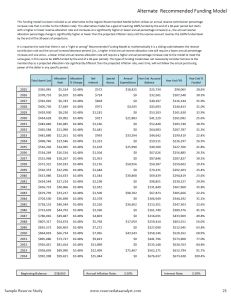
Funding Model - Projections
Funding Model Projections for each reserve funding model in the study. Typically at a minimum Recommended, Baseline and Current Funding Model Projections will be included. The list includes annual contributions, interest earned, annual expenditures, projected year-end balance the fully funded balance and percent funded for each year of the study.
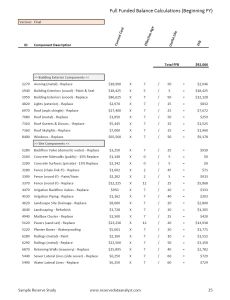
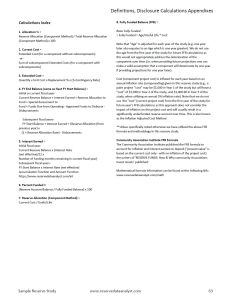
Fully Funded Balance Calculations
This page shows the Fully Funded Balance (FFB) calculation for each component which when added up equals the Fully Funded Balance (Ideal Balance) provided in the reserve study. Note that this is not the total cost of replacement or the cost to rebuild the building but is a number that is an ideal reserve account balance at one point in time.
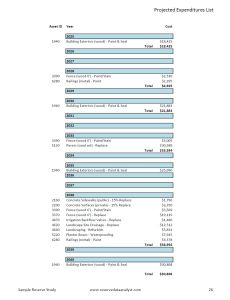
Annual Expenditures List
Projected annual expenditures indicated by components repair / replacement projects in each year of the reserve study as well as total accumulated projected costs associated with them in each of those years. The expenditure reports are provided in various formats including a chart & spreadsheet over the thirty years covered in the study.
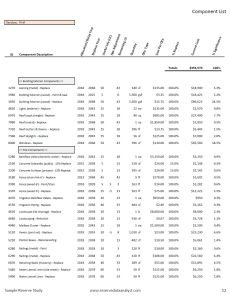
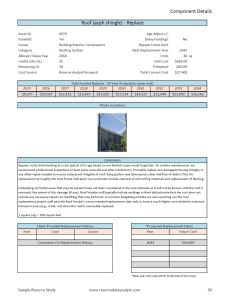
Component Detail Reports
Detailed commentary for each component including current costs, useful life, remaining useful life, next replacement year, location, measurement information, maintenance, repair and replacement suggestions. Photographic inventory will typically be included.
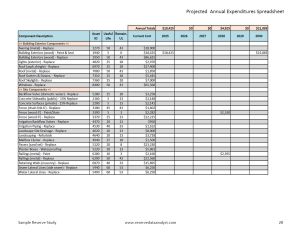
Annual Expenditures Spreadsheet
This spreadsheet format is commonly utilized by accountants or bookkeepers and shows the components, their respective replacement years and their projected costs in those years.

